What is the difference between conventional SR report and Flat4’s digital error maps?
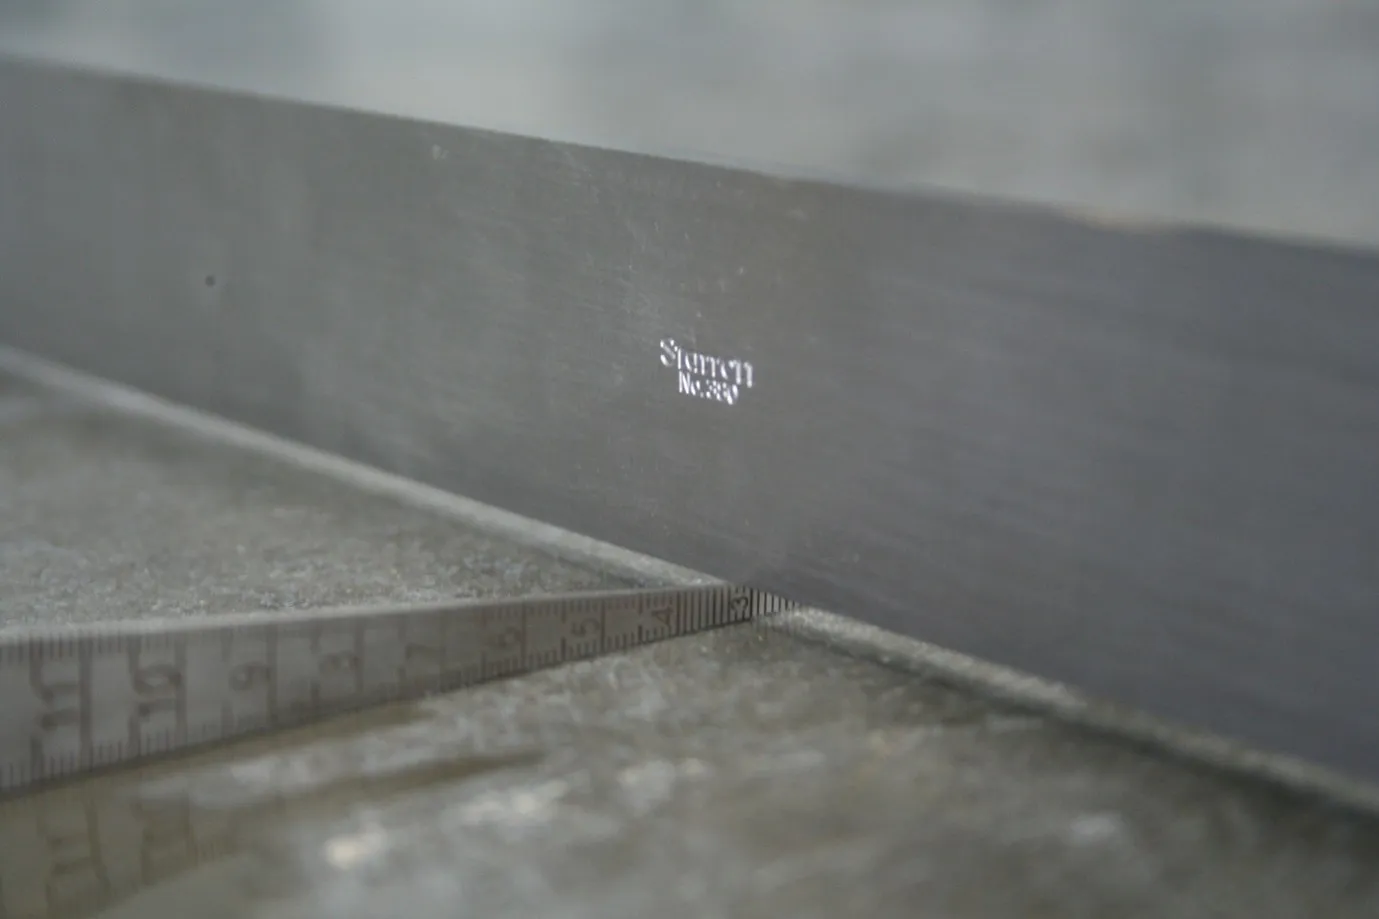
Conventional Surface Regularity (SR) reports are based on manually operated survey equipment, such as straightedges, automatic levels, and profilers. The first common characteristic of these three types of equipment is that they all present results local to their immediate position during the survey. In other words, they cannot produce results accurately referenced to a coordinate system without additional geo-referencing, such as a secondary survey with a total station or at least a tape measurement. This makes it impossible to precisely localize the results - and therefore the errors - which can jeopardize the accountability of the report.
Another limitation is the amount of information that can be collected with these tools in a reasonable time. The output of a straightedge or a levelled grid consists of relative level values of points positioned approximately every few metres on the floor. A surveyor can only complete a finite number of these measurements during a shift. Using a modern digital level, where the staff is placed point by point on a floor grid, about 1,500 accurate readings (with sub-millimetre precision) can be taken over an 8–10-hour shift. With a 2 m straightedge, typically fewer than half that number are possible, due to the awkward working position, fully analogue readings, and the cumbersome tool.
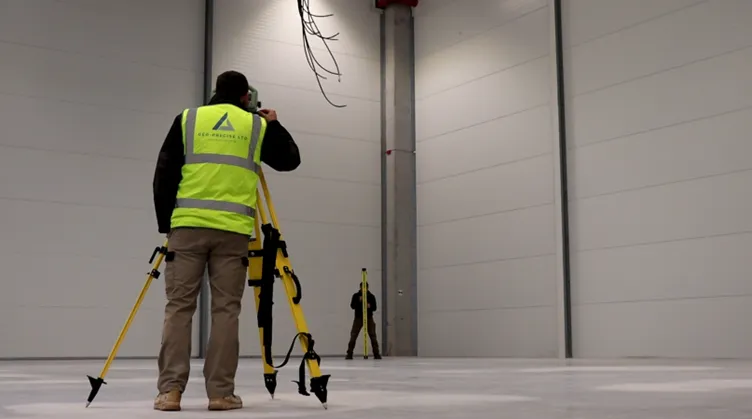
This is why most traditional floor surveying standards require only a 2 m or 3 m grid to be surveyed with levels for levelness assessment, and only about 10% of those grid lines to be checked for flatness. For example, surveying a 10,000 m² warehouse floor with conventional methods would take 16–20 hours.
Profilographs are more advanced. They can take thousands of measurements along a line in only a few minutes, making it feasible to increase flatness checks to 100% of the grid lines during a single shift. However, the positioning of these lines often relies on tape measurements, which can introduce positional errors of 200–300 mm over a 100 m slab. Profilographs are also limited in length, meaning they cannot provide long distance levelness data that is calculated directly. Although it is possible to derive longer-distance level deviations from floor profiles, these results are not particularly reliable, as each short section is measured relative to the previous one and therefore prone to accumulated errors. This is one of the reasons why, profilograph based SR reports often still require supplemental measurements with a digital level for accurate levelness results.
 Figure 1: 4m levelness and flatness calculations derived from measurement of a 1m long device.
One might argue that these reports are essentially statistical analyses, where the results are sample measurements used to define the overall floor quality. In this case, the exact location of each reading could be considered of secondary importance. This reasoning holds - until a floor fails the test and requires remediation. Grinding down humps or filling dips (the latter being rarely used due to durability and integrity concerns) demands precise knowledge of where the errors are located. With super flat floors now the standard in robotic warehouses, this precision has become critical. These facilities require the entire floor to remain within tolerance. From this point onward, both the location of the errors and the density of the measured points become vital. In conventional practice, when a floor fails, the survey team tries to locate errors using grid-based reports. This depends on whether the grid is still marked on site - chalk lines often disappear during construction. If not, the team must attempt to re-establish the same grid system, often without reliable control points. Once errors are found - represented only as isolated points or linear sections - the team must conduct a much denser survey to map the extent of the issue and define the required grinding depth. This process is as complicated and time-consuming as it sounds. And it does not even account for the possibility of multiple overlapping errors in the same area, which if ground incorrectly, can create a domino effect - where fixing one error creates another - ultimately doubling the grinding effort required.
Fast Forward to present days
The solution lies in 21st-century technology. With laser scanners, we can accurately model the floor surface in a fast, and thorough survey. Flat4, Even Horizon Ltd’s algorithmic, geometry-based software, processes the scan data to compare any part of the floor with any other, running millions of calculations per second in virtual space. The entire survey - including a 50 mm grid-based output report - takes 30–50% less time (depending on site conditions) than a traditional 3 m grid survey. Yet the result is based on 3,600 times more data points than the conventional method. It would take years to produce the same amount of data even with a profiler, generating tens of thousands of pages of graphs identifiable only by gridline numbers, therefore, it would take yet another year to understand how each line relates to the others and calculate the grinding.
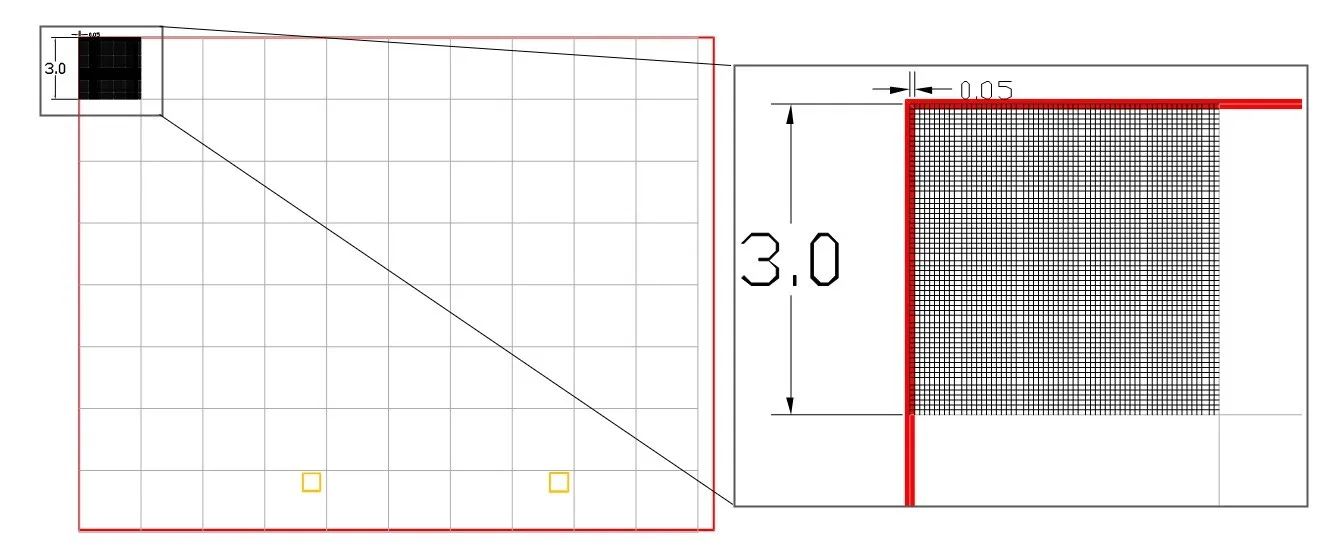 Figure 2: 3m and 50mm grid compared
Flat4’s results are derived from point cloud data consisting of billions of precisely coordinated points. This allows accurate localization of all findings and presents them in a way that helps site teams understand the real location, size, extent, and nature of the errors. Surveyors can then mark these points on site to millimetre accuracy within minutes, along with exactly how much each exceeds tolerance.
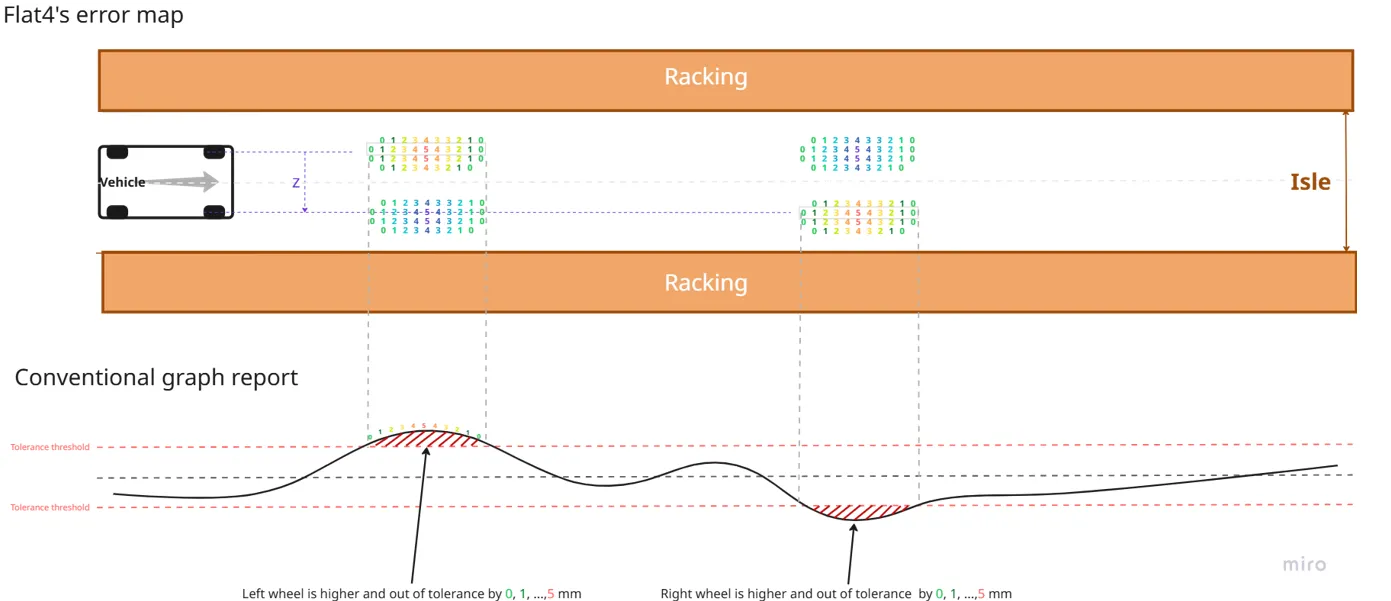 Figure 3: Flat4’s Defined Movement error visualisation explained
Because the errors are already calculated and located during reporting, Flat4 can also generate the remediation plan: an effective digital grinding map. It is presented as a scaled engineering drawing with distinctive color coding and grinding values accurate to 0.1 mm, all related to the floor plan of the building.
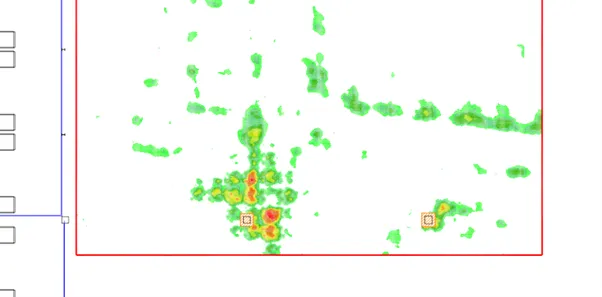 Figure 4: Grinding plan
As the demand for 100% flat floors continues to rise in warehouse construction, it is time to match industry expectations with faster, broader, and more accurate solutions - built on real-time technologies.